MN’s population is gradually increasing. From 2018-2070, MN is projected to gain 1.1 million new residents. MN’s older adult residents, aged 85+, are expected to double in the next 35 years, and in the next decade, retirees will outnumber school-aged children for the first time in our state’s history. MN’s minority populations saw an increase of 18% between 2013 and 2018. This increase in residents of color will continue to grow, becoming ⅓ of the state’s total population by 2053 (source).
In 2021, the total female population represented 49.9% (2,846,722) of the state’s total population (5,707,390 residents). The number of females ages 18+ was 2,208,481, about 77.6% of all MN women. Women 65+ represent 23.3% of MN women 18+ (source).
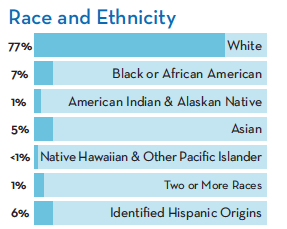
Ethnicity
Total Population of MN (2020 Census): 5,706,494
Total Population (One Race): 5,360,773 (Race source; Ethnicity source)

Total Population (Two or More Races): 345,721
| White; Black or African American | 57,953 (16.8%) |
| White; American Indian and Alaska Native | 65,819 (19%) |
| White; Asian | 45,265 (13.1%) |
| White; Native Hawaiian and Other Pacific Islander | 1,882 (0.5%) |
| White; Some Other Race | 133,575 (38.6%) |
| Black or African American; American Indian and Alaska Native | 5,029 (1.5%) |
| Black or African American; Asian | 2,674 (0.77%) |
| Black or African American; Native Hawaiian and Other Pacific Islander | 313 (0.1%) |
| Black or African American; Some Other Race: | 4,770 (1.4%) |
| American Indian and Alaska Native; Asian | 790 (0.23%) |
| American Indian and Alaska Native; Native Hawaiian and Other Pacific Islander | 104 (0.03%) |
| American Indian and Alaska Native; Some Other Race | 2,660 (0.77%) |
| Asian; Native Hawaiian and Other Pacific Islander | 1,477 (0.43%) |
| Asian; Some Other Race | 1,609 (0.47%) |
| Native Hawaiian and Other Pacific Islander; Some Other Race | 355 (0.11%) |
Rural Health Demographics
Since our last Report Card, there have been some shifts in population growth. Categorizing counties by “urbanness” and “ruralness” gives an alternative way to look at the state, instead of by location. Most rural counties are experiencing an in-migration of 30-49-year-olds. The LGBTQ population in Minnesota has an annual income of less than 24k. Population gains in rural areas are slowing down compared to the growth seen from 2010-2019 (source).

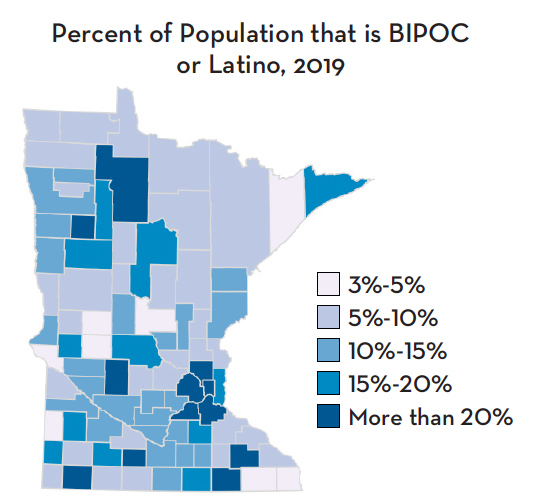
Most counties in Greater Minnesota have a population that is 10% or more Black, Indigenous, Latino, or other People of Color.
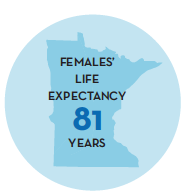
Average Life Expectancy (source)
In 2020, the average life expectancy is 79.1 for all Minnesotans, and for MN women, it is 81.4. MN ranks 7th in the nation for female life expectancies at birth.
Relationship status (source)
In 2019, nearly 43% of the female population reported never being married or were under 15 years of age. Approximately 41% (1,169,918) of the female population reported being married, 5.9% were widowed, 9.2% were divorced, and less than one percent (20,605) reported being separated from their partner.
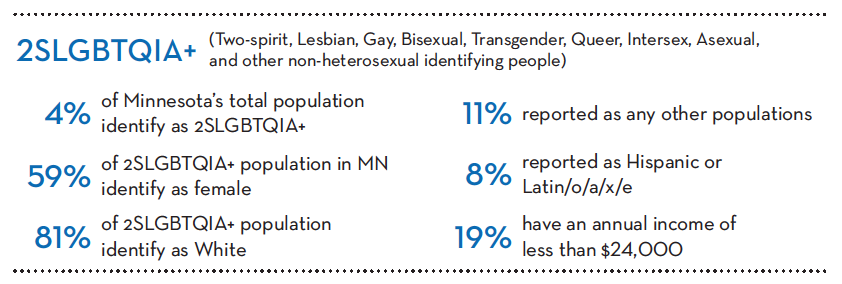
For more information about MN’s LGBTQ+ population and their health, please explore the 2021 Voices of Health Access Survey from Rainbow Health.
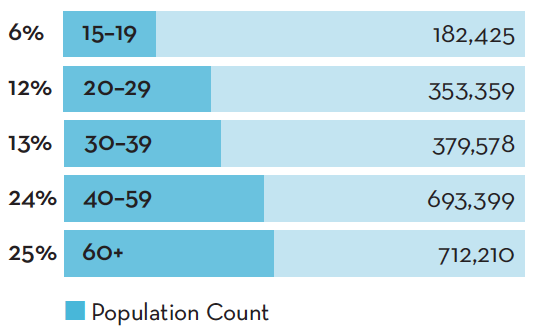
Age
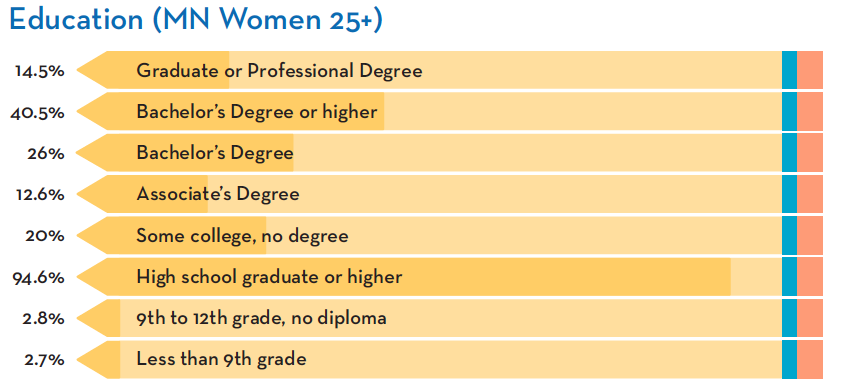
Education