Minnesota’s (MN) population is gradually increasing. From 2016 to 2050, MN’s population is projected to increase by 15%, from 5.53 million to 6.36 million. Currently, female population growth is slightly slower than male population growth. It’s expected that the female growth rate is projected to remain lower than male’s population past 2020.
In 2018, the total female population represented 50.2% (2,186,378) of the state’s population. The number of females ages 15-44 was 1,074,005, about 38% of all MN women, representing a .07% change from 2017 to 2018 (source). Women over 80 accounted for 60% of the population in rural MN, 62% in small town MN, 64% in large town MN and 63% in urban MN (source; Greater Minnesota: Refined & Revisited report, p. 22).
An “urban area” is defined as a Census tract that has 50,000 residents or more. “Large towns” must have between 10,000 and 49,999 residents, and “small towns” are made of between 2,500 and 9,999 residents. A Census tract that has a primary commuting flow outside of urban areas and urban clusters is classified as “rural.”
Rural health demographics (source)
About 73% of Minnesota’s population, numbering more than 3.9 million people, live in an urban geography. Eleven percent, or nearly 609,000 people, live in or nearby large towns with 10,000-49,999 residents. Another 7%, or nearly 390,000 people, live in or nearby small towns with 2,500-9,999 residents, while 8% of Minnesota’s population, representing more than 434,000 people, live in more remote rural areas. Further details can be found in the Greater Minnesota: Refined & Revisited report.
Average life expectancy at birth (and national average age)
The average life expectancy at birth of all Minnesotans is 81 years (reported in 2019), one of the highest in the nation (source).
Relationship Status (source)
In 2019, nearly 43% of the female population reported to never be married or were under 15 years of age. Approximately 41% (1,165,355) of the female population reported to be married, 6% were widowed, 9% were divorced, and less than one percent (20,407) reported being separated from their partner.
Lesbian, Gay, Bisexual, Transgender, Queer (LGBTQ) (source)
The LGBTQ community makes up 4.1% of the total population in Minnesota. Of the LGBTQ population, 59% is females, 81% is White, 8% reported as Latino/a/x or Hispanic, and 11% reported to identify as another race/ethnicity. In 2019, 19% of the LGBTQ population in Minnesota reported to have an annual income of less than $24,000.
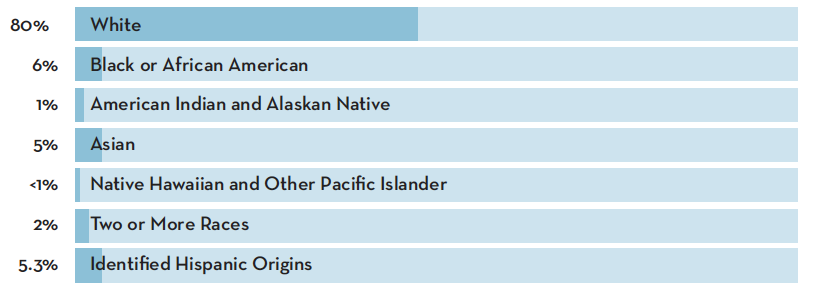
Ethnicity (source)
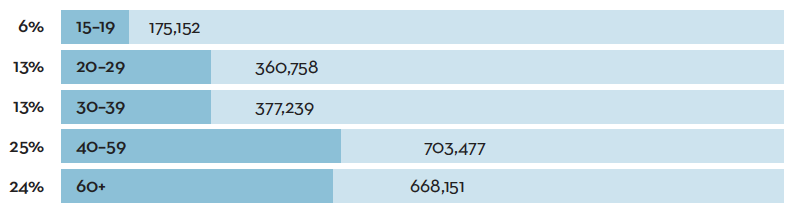
Age (source)
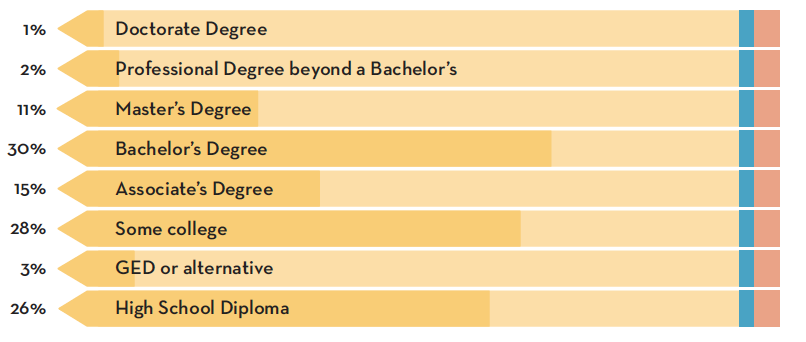
Education (source)
See “About the Data Sources” for more details on how data were collected.